

Data Analytics Strategy: Building Your Roadmap to Actionable Insights
Data analytics has become essential for modern business success. Companies that effectively collect and analyze data gain clear advantages over competitors, while those that don't risk falling behind. But what does it really mean to build a strong analytics program, and how are leading organizations using data to drive results?
From Reporting to Predictive Insights
The field of data analytics has come a long way from its early days. In the past, analysis focused mainly on describing what happened - like when Henry Ford's factories tracked assembly line speeds to measure productivity. While useful, this backward-looking approach had clear limitations. Today's analytics can predict future trends and recommend specific actions. For instance, retail companies now forecast inventory needs and optimize pricing in real-time. This shift from understanding the past to shaping the future represents a major leap forward in how businesses use data.
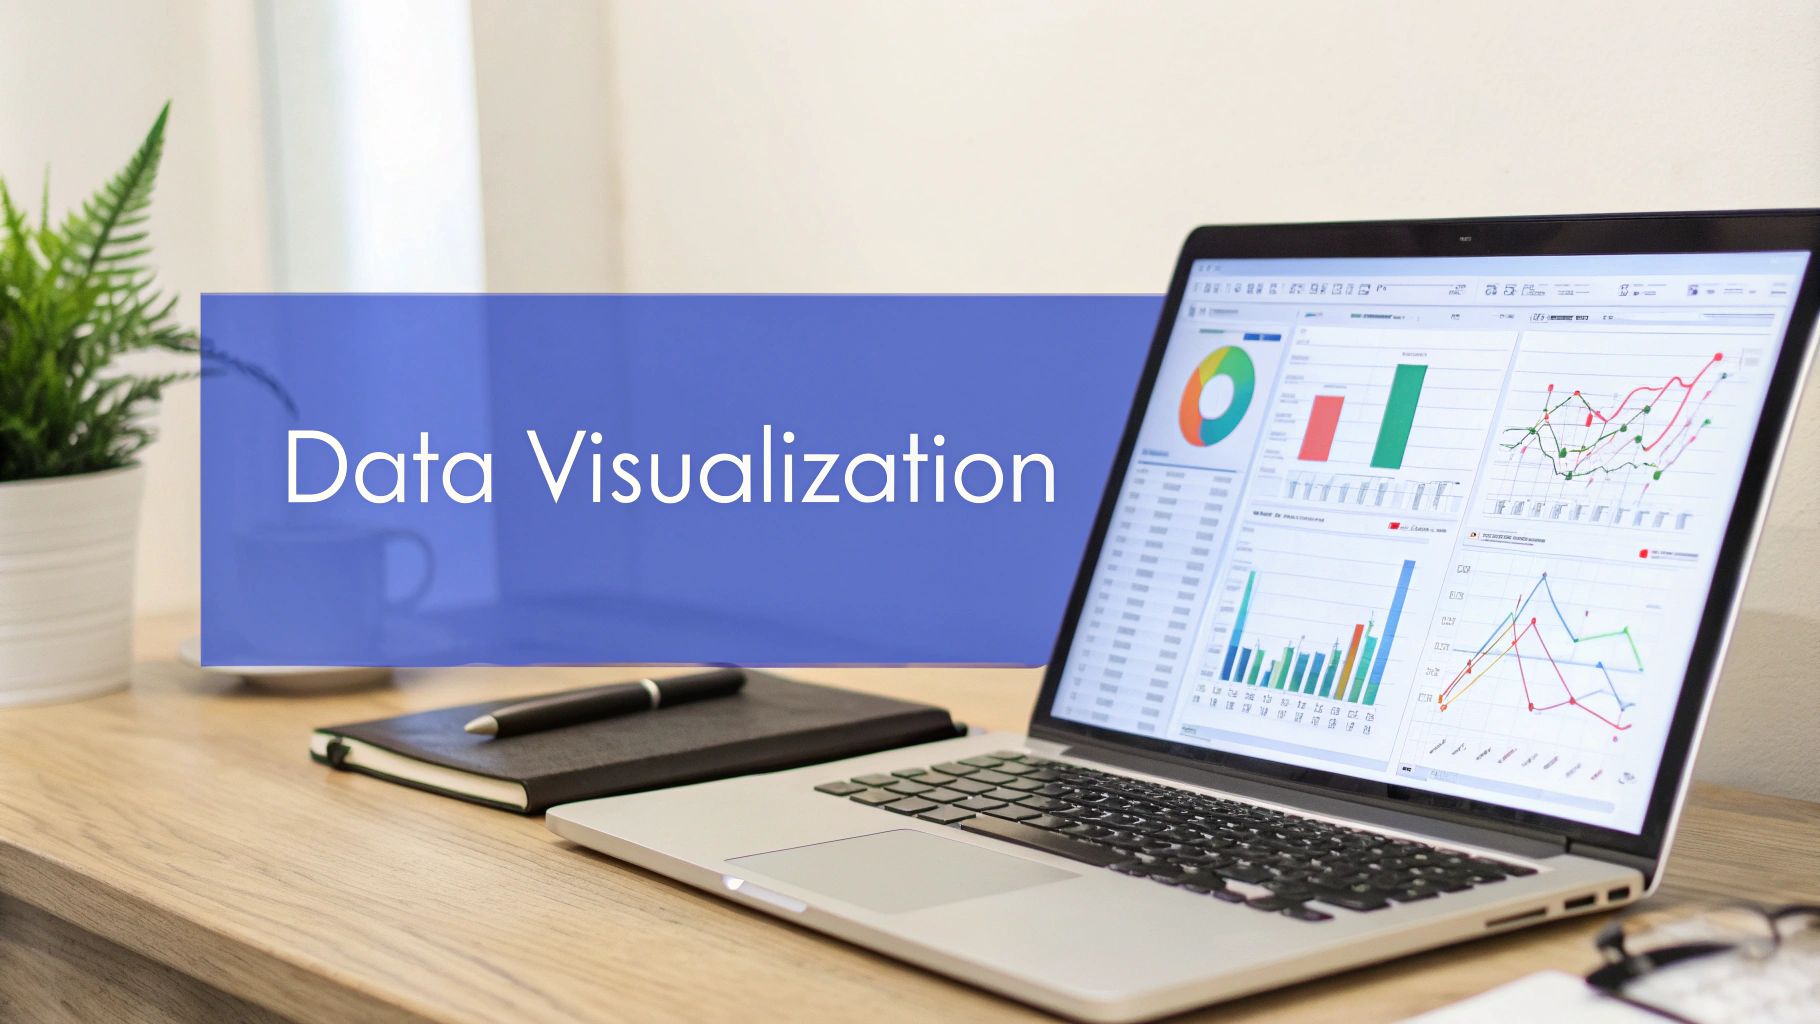
The Power of Visualization
Modern data visualization tools have made complex analytics accessible to everyone, not just technical experts. Gone are the days when insights were buried in dense spreadsheets. Now, interactive dashboards and compelling visuals help teams quickly spot patterns and trends. For example, sales managers can instantly see which products are performing well in different regions through clear charts and graphs. This accessibility has helped create a culture where decisions at all levels are guided by data rather than just intuition.
The Role of AI and Machine Learning in Data Analytics Strategy
Artificial Intelligence and Machine Learning have taken data analytics to new heights. These technologies can process massive datasets and uncover subtle patterns that humans would miss. A retail company might use machine learning to analyze years of customer purchase data, website interactions, and external factors to predict what individual shoppers are likely to buy next. AI also helps ensure data quality by automatically detecting and fixing errors. This improves the accuracy and reliability of analytics across the organization.
Building a Sustainable Competitive Advantage with Data
Success with data analytics requires more than just implementing the right tools - it demands building an organization-wide data culture. This means investing in training so employees understand how to interpret and use data effectively. It also requires clear processes for managing data quality and security. For example, a manufacturing company might train production managers to use analytics dashboards while also establishing strict data governance policies. Organizations that get these fundamentals right can use data not just for small improvements, but for major competitive advantages. They make better strategic decisions, serve customers more effectively, and adapt more quickly to change.
Building Your Analytics Foundation
The most effective data analytics programs start with solid fundamentals. Just like building a house needs a strong foundation before adding walls and a roof, organizations need core systems and processes in place to make their data useful. Let's explore the key building blocks that enable successful analytics.
Data Governance: The Cornerstone of Your Strategy
Clear rules and processes for managing data are essential. Think about it like this: if your marketing and sales teams define "conversion" differently, you'll end up with confusing reports that lead to poor decisions. Good data governance creates shared definitions and standards so everyone works from the same playbook. It determines who owns and controls data, how changes are tracked, and how to keep information secure. When done right, data governance helps teams collaborate effectively using consistent, reliable information.
Data Integration: Connecting the Dots
Most companies today collect data from many places - their Salesforce CRM, marketing tools, website analytics, and more. Making this data truly valuable means bringing it all together smoothly. It's like putting together a jigsaw puzzle - each piece needs to fit perfectly with the others to show the complete picture. The challenge isn't just technical connections between systems, but ensuring the data stays accurate and consistent as it flows between them. When data stays siloed and fragmented, you miss important insights that come from seeing the full context.
Data Quality Management: Ensuring Reliable Insights
Your analysis is only as good as your data quality. Messy data leads to flawed conclusions - like trying to navigate with an inaccurate map. That's why successful analytics requires systematic data cleaning, validation and enrichment. For example, customer records full of duplicates or outdated information will skew your understanding of your customer base. By implementing quality checks and cleanup processes, you build trust in your data and confidence in the resulting insights.
Tool Selection: Choosing the Right Technology
Picking the right analytics tools is crucial but can be overwhelming. You need solutions for storing, processing, visualizing and reporting on data that match your needs and capabilities while integrating with your existing systems. Like a chef selecting kitchen equipment, having the right tools for the job makes all the difference. You might want to check out How to master... for guidance on choosing AI tools for your business.
Building Scalable Processes: Planning for Growth
Finally, your analytics foundation needs room to grow. As your organization expands and data volumes increase, your processes must adapt smoothly. This means creating automated workflows, clear documentation, and nurturing a data-driven mindset across teams. Think of it like designing a house - you want the structure to support both current needs and future additions. With scalable processes in place, your analytics capabilities can evolve alongside your business without requiring major rebuilds.
Turning Historical Data into Future Insights

Looking at past data shouldn't just be an exercise in nostalgia - it's a powerful way to shape what's ahead. By carefully analyzing historical information, businesses can spot patterns and trends that point the way forward. The key is taking a structured approach to mining these valuable insights from your data.
Identifying Key Historical Data
Not all historical data carries equal weight - you need to focus on metrics that truly matter for your goals. Take a retail business, for example. Simply tracking total sales over the years won't reveal much about why customers buy or which products perform best. A smarter approach is to break down sales data by category, region, and customer segments. This detailed view helps spot the patterns that drive real business decisions.
Methodologies for Historical Data Analysis
There are several proven ways to get meaningful insights from historical data. Pattern recognition helps businesses spot recurring customer behaviors and market shifts, making it easier to prepare for similar situations in the future. Trend analysis reveals gradual changes that might otherwise go unnoticed. For instance, a manufacturing company analyzing years of production data might notice a machine's efficiency slowly declining, allowing them to schedule repairs before a major breakdown occurs.
Predictive Modeling and Business Value
Moving beyond basic analysis, predictive modeling uses statistical methods to forecast what might happen next. This shifts decision-making from reactive to proactive. Consider how a bank might analyze past loan data to build models that estimate default risks for new applications. By applying these insights directly to operations, businesses can work more efficiently, allocate resources better, and find new opportunities for growth.
Combining Historical Analysis with Modern Tools
When you pair historical analysis with today's analytics tools, the insights become even more valuable. Data visualization helps present complex information in clear, understandable ways. AI and machine learning can process huge datasets to find subtle patterns humans might miss. For example, an online store could analyze past website traffic, customer profiles, and purchase history to create personalized product recommendations that boost sales. By learning from what worked (and didn't work) in the past, companies can make smarter choices about their future direction and stay ahead in their markets.
Mastering Modern Analytics Tools

Making data analytics work requires hands-on mastery of practical tools, not just theory. While the number of available analytics platforms can seem daunting, taking a structured approach helps identify which tools will best serve your specific needs. The key is matching capabilities to your actual business requirements rather than chasing the latest trends.
Choosing the Right Tools for Your Data Analytics Strategy
Success starts with understanding that what works for one organization may not work for another. Your ideal toolset depends on several factors: the business questions you need to answer, your data types and sources, and your team's skills. A social media team might need tools focused on tracking sentiment and engagement, while finance teams typically require robust statistical analysis software. Integration is also critical - your tools need to work together smoothly to prevent data from getting stuck in isolated silos.
Key Categories of Analytics Tools
The main types of analytics tools include:
- Data Storage and Warehousing: These form your data foundation by providing a central place to store information. Options range from cloud platforms like BigQuery to on-site solutions.
- Data Integration and ETL: These tools help pull data from different sources, clean it up, and prepare it for analysis. Quality data is essential for meaningful insights.
- Data Visualization and Reporting: Tools like Tableau and Power BI help create clear visual representations of complex data through interactive dashboards and reports.
- Advanced Analytics and Machine Learning: Platforms like TensorFlow and PyTorch enable predictive analysis - for example, helping retailers forecast customer behavior or optimize pricing.
- Business Intelligence (BI) Platforms: These combine multiple capabilities in one package for streamlined analysis workflows.
Building a Flexible and Scalable Tech Stack
The best approach is building a toolkit that can grow and adapt with your needs. Avoid getting locked into rigid systems that might not keep up as your data volume and analysis needs expand. Look for tools with strong APIs and integration options. Consider how well each tool handles increased data loads and multiple users working simultaneously. For more insights on scaling your analytics capabilities, check out: How to master...
Prioritizing Data Security and Quality
Above all, protect your data and ensure its accuracy. Choose tools that meet privacy regulations and have strong security features. Set up regular data quality checks to catch and fix errors, keep information consistent across systems, and verify that your insights are reliable. This builds confidence in your analytics program and leads to better business decisions based on trustworthy data.
Creating Compelling Data Stories
An effective data analytics strategy goes beyond numbers and charts - it's about connecting with people through stories that move them to act. Just like any skilled storyteller, organizations need to present data in clear, engaging ways that make complex information relatable and meaningful to different audiences. This means evolving beyond static reports into dynamic visualizations that bring data to life.
Crafting Dashboards That Drive Engagement
A dashboard is only valuable if people actually use it. Many dashboards become overwhelming data dumps that hide key insights beneath layers of irrelevant metrics. The best dashboards are thoughtfully designed to highlight what matters most in a clean, intuitive way. Think of curating a museum exhibit - you wouldn't display every artifact at once. Instead, you carefully select and arrange the most important pieces to tell a clear story. Your data dashboards should follow the same principle by focusing on essential KPIs and presenting them in ways that make patterns and insights immediately clear.
Visualizing Data for Different Audiences
The visualization format needs to match your audience's needs and data literacy level. A sales team may grasp trends best through bar charts, while executives might prefer summary tables with key takeaways. Just as teachers adapt their methods for different learning styles, data analysts must choose visualizations that resonate with each viewer. For instance, marketing teams often benefit from heatmaps showing website engagement patterns, while finance prefers line graphs tracking performance over time. This targeted approach ensures everyone can understand and apply the insights.
Building Narratives That Inspire Change
Raw data without context is meaningless. To make data truly impactful, you need to weave it into stories that reveal why the numbers matter and what actions they suggest. Simply presenting sales figures alone rarely drives change. But when you connect those numbers to market shifts, competitor moves, and campaign results, you empower people to make strategic decisions. This transforms data from abstract information into a catalyst for meaningful action.
For example, consider analyzing customer churn data. A rising churn rate by itself is concerning but not actionable. However, examining that trend alongside customer demographics, purchase patterns and feedback reveals the underlying causes. Perhaps specific customer segments are frustrated by recent product changes, or support teams are struggling to resolve issues quickly. When presented as part of a clear narrative, these insights motivate targeted improvements in retention strategies. You might be interested in: How to master... for guidance on using AI in data analysis and building insightful narratives. By crafting compelling data stories, you turn statistics into powerful tools for driving strategic decisions and organizational progress.
Scaling Your Analytics Impact
A well-built data analytics strategy is only the beginning. To create real change, you need to weave data-driven decision-making into every part of your organization. This means moving past one-off analytics projects to make data insights guide both strategy and day-to-day operations across all teams.
Building a Data-Driven Culture
The foundation of scaled analytics is creating a culture where data drives decisions. Rather than turning everyone into data scientists, the goal is to help people at all levels use data confidently in their work. This starts with targeted training - sales teams learning to use customer segmentation data, marketing teams analyzing campaign metrics, and so on. Creating spaces for teams to share knowledge and best practices, like regular meetups or internal forums, helps spread data skills naturally throughout the organization.
Overcoming Resistance to Data-Driven Decisions
When scaling analytics, you'll likely face pushback from those who prefer gut instinct over data. Some may doubt whether the data tells the full story or question if insights really apply to their work. The key is showing clear examples of success. For instance, if data analysis helped boost customer retention by 15%, share that story widely. Being open about how data shapes decisions and highlighting real results builds trust and shows the concrete value of taking a data-driven approach.
Measuring and Demonstrating Impact
To keep growing your analytics program, you need to prove its worth through clear metrics tied to business goals. Track specific numbers that matter - revenue growth, customer satisfaction scores, cost savings, or faster product launches. Create simple dashboards showing how data-driven choices affect these key metrics. When you can point to exact figures showing return on investment, it's much easier to make the case for expanding analytics further.
Ensuring Sustainable Growth
Taking analytics to the next level requires planning for the long term. Focus on building systems that can grow with you - automate routine data tasks, set up infrastructure that can handle more data over time, and develop your team's skills through training and mentoring. This creates a strong base where your analytics capabilities can expand naturally as your organization grows, without hitting major roadblocks along the way.
Ready to transform your business with the power of AI? Dixon Humphreys offers expert AI development, training, and consulting to help you get the most value from your data. Visit us today to learn how we can help guide your AI journey.